
Here we go again! Prices look to have
bottomed as the supply shortfall dominates, but watch rates and unemployment
Key points
– Australian home prices rose again in April & along with other indicators suggest the home price downturn is over.
– A surge in demand on the back of high immigration and constrained supply appear to be dominating the negative impact of higher interest rates.
– As such we have revised up our property price forecasts to flat to up slightly for this year with a 5% rise next year.
– However, the risk of another down leg in prices is high as interest rate hikes continue to impact.
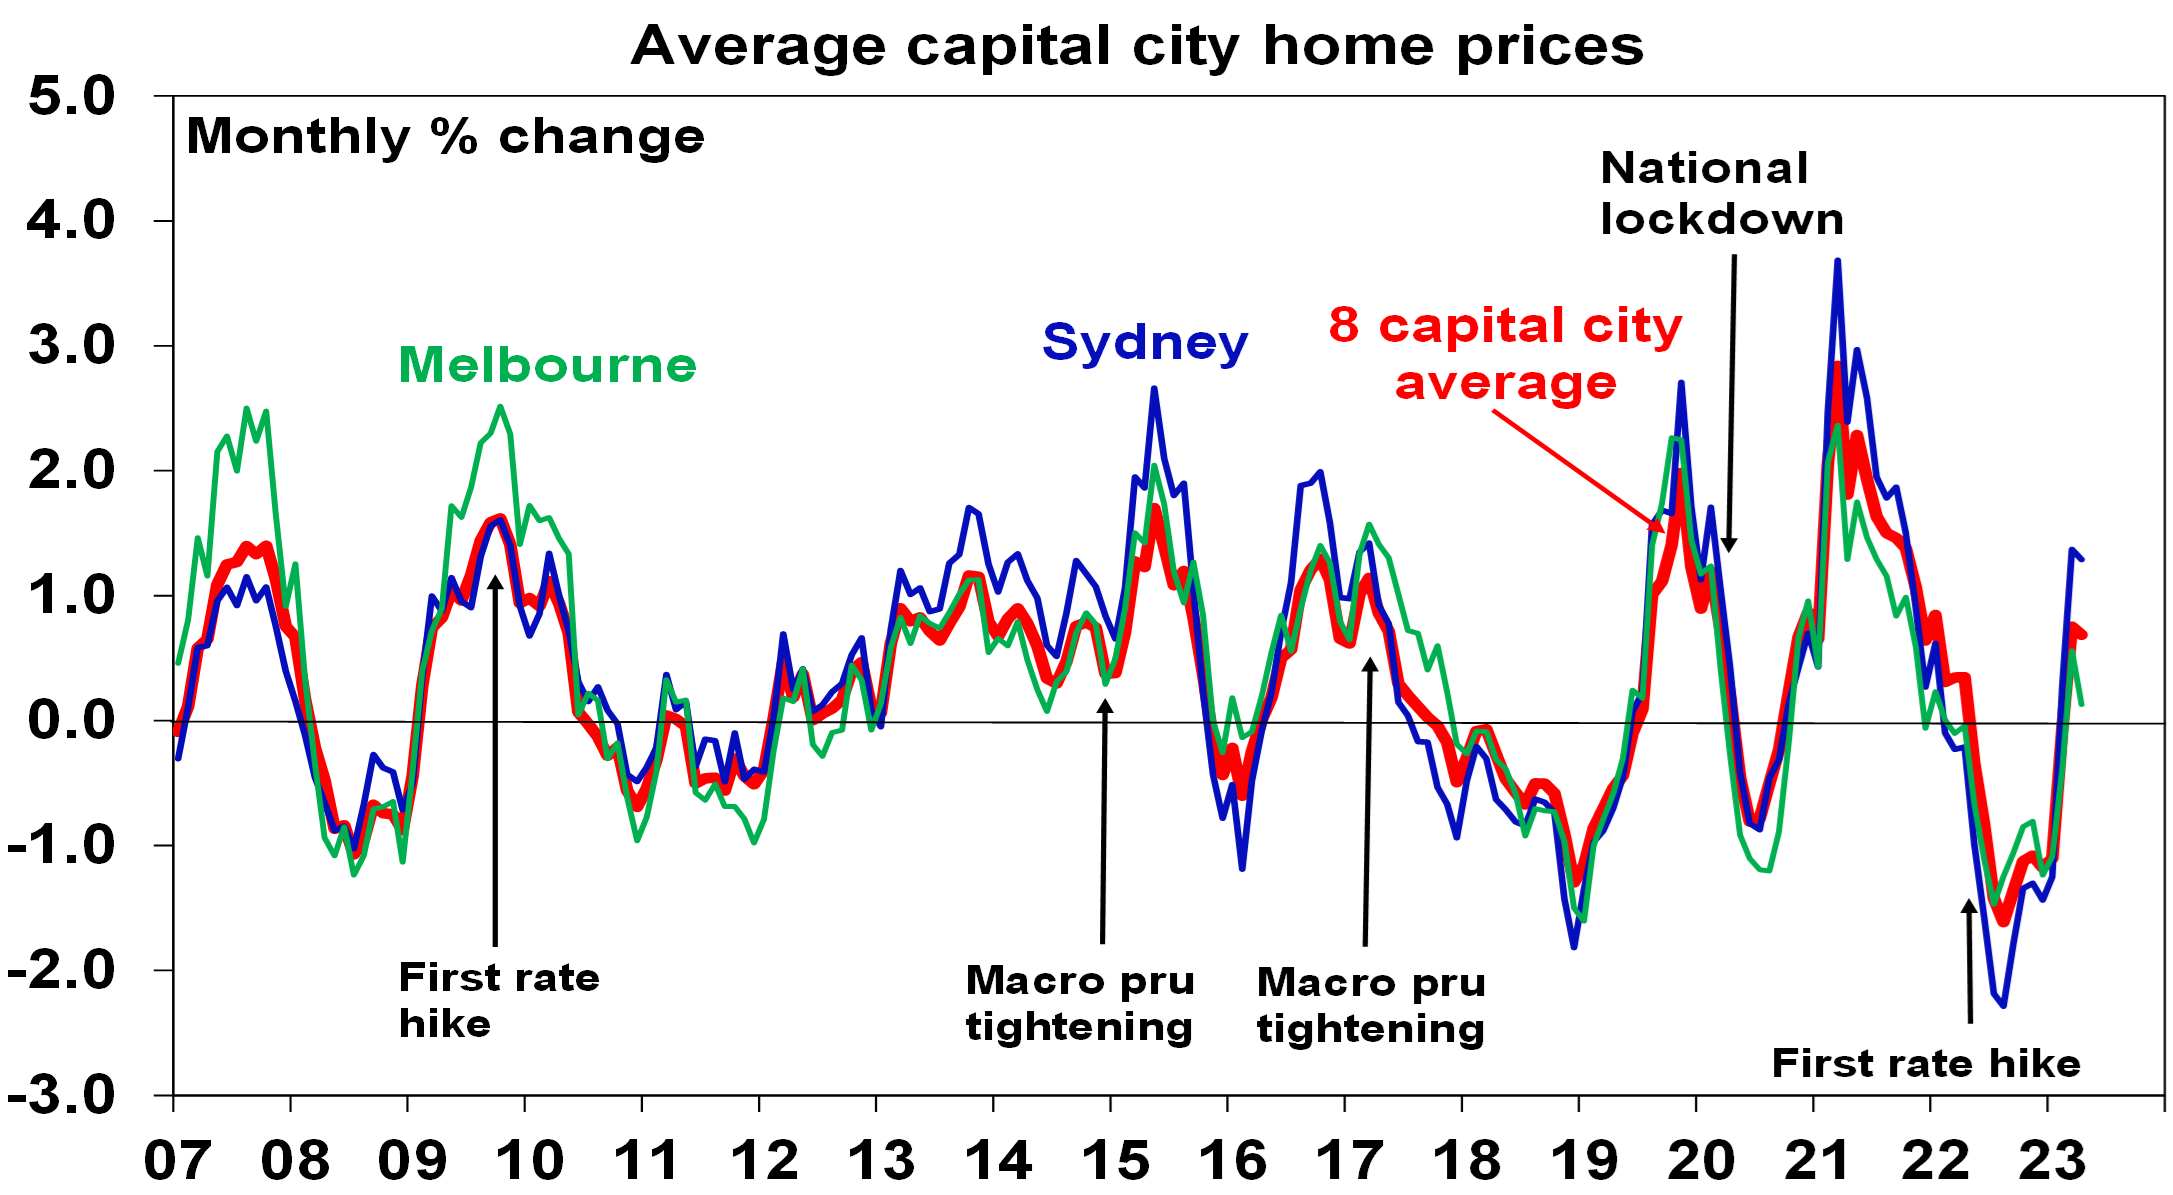
Home prices up again in April
Yet again the Australian residential property market is surprising with its resilience and defying forecasts for sharp falls. After falling 9.1% from their high in April last year to their low in February, national average home prices rose another 0.5% in April after a 0.6% gain in March and are up by 1.2% from their February low. Sydney has led the charge with a 1.3% rise in April and is up 3% since January.
Australian dwelling price growth, to April
| Apr % chg | Annual % chg | % recent peak to low | % recent low to now | |
| Sydney | 1.3 | -10.7 | -13.8 | 3.0 |
| Melbourne | 0.1 | -8.9 | -9.6 | 0.7 |
| Brisbane | 0.3 | -9.8 | -11.0 | 0.4 |
| Adelaide | 0.2 | 1.3 | -2.4 | 0.2 |
| Perth | 0.6 | 1.3 | -0.9 | 1.1 |
| Hobart | 0.0 | -12.7 | -13.0 | NA |
| Darwin | -1.2 | -0.5 | -3.3 | NA |
| Canberra | 0.0 | -9.3 | -9.5 | NA |
| Capital city avg | 0.7 | -8.4 | -9.7 | 1.4 |
| National avg | 0.5 | -8.0 | -9.1 | 1.2 |
Source: CoreLogic, AMP
Source: CoreLogic, AMP
Solid auction clearance rates, signs of a turn up in housing finance & a pickup in upper end property prices provide confirmation of the upswing. We had thought that after a brief bounce, prices would resume their downswing as higher interest rates continue to impact, but its looking increasingly likely that prices have bottomed as a deteriorating demand/supply imbalance dominates. As such, our forecast for a top to bottom fall of 15-20% fall out to late this year is looking too pessimistic and we have revised up our property forecasts. However, the current property market dynamics of a sharp rise in interest rates and slowing economic growth but strong underlying demand and constrained supply are very unusual, so the risk of another down leg remains high. This note looks at these conflicting dynamics.
A far worse property demand/supply imbalance
The worsening demand/supply imbalance reflects a mix of factors.
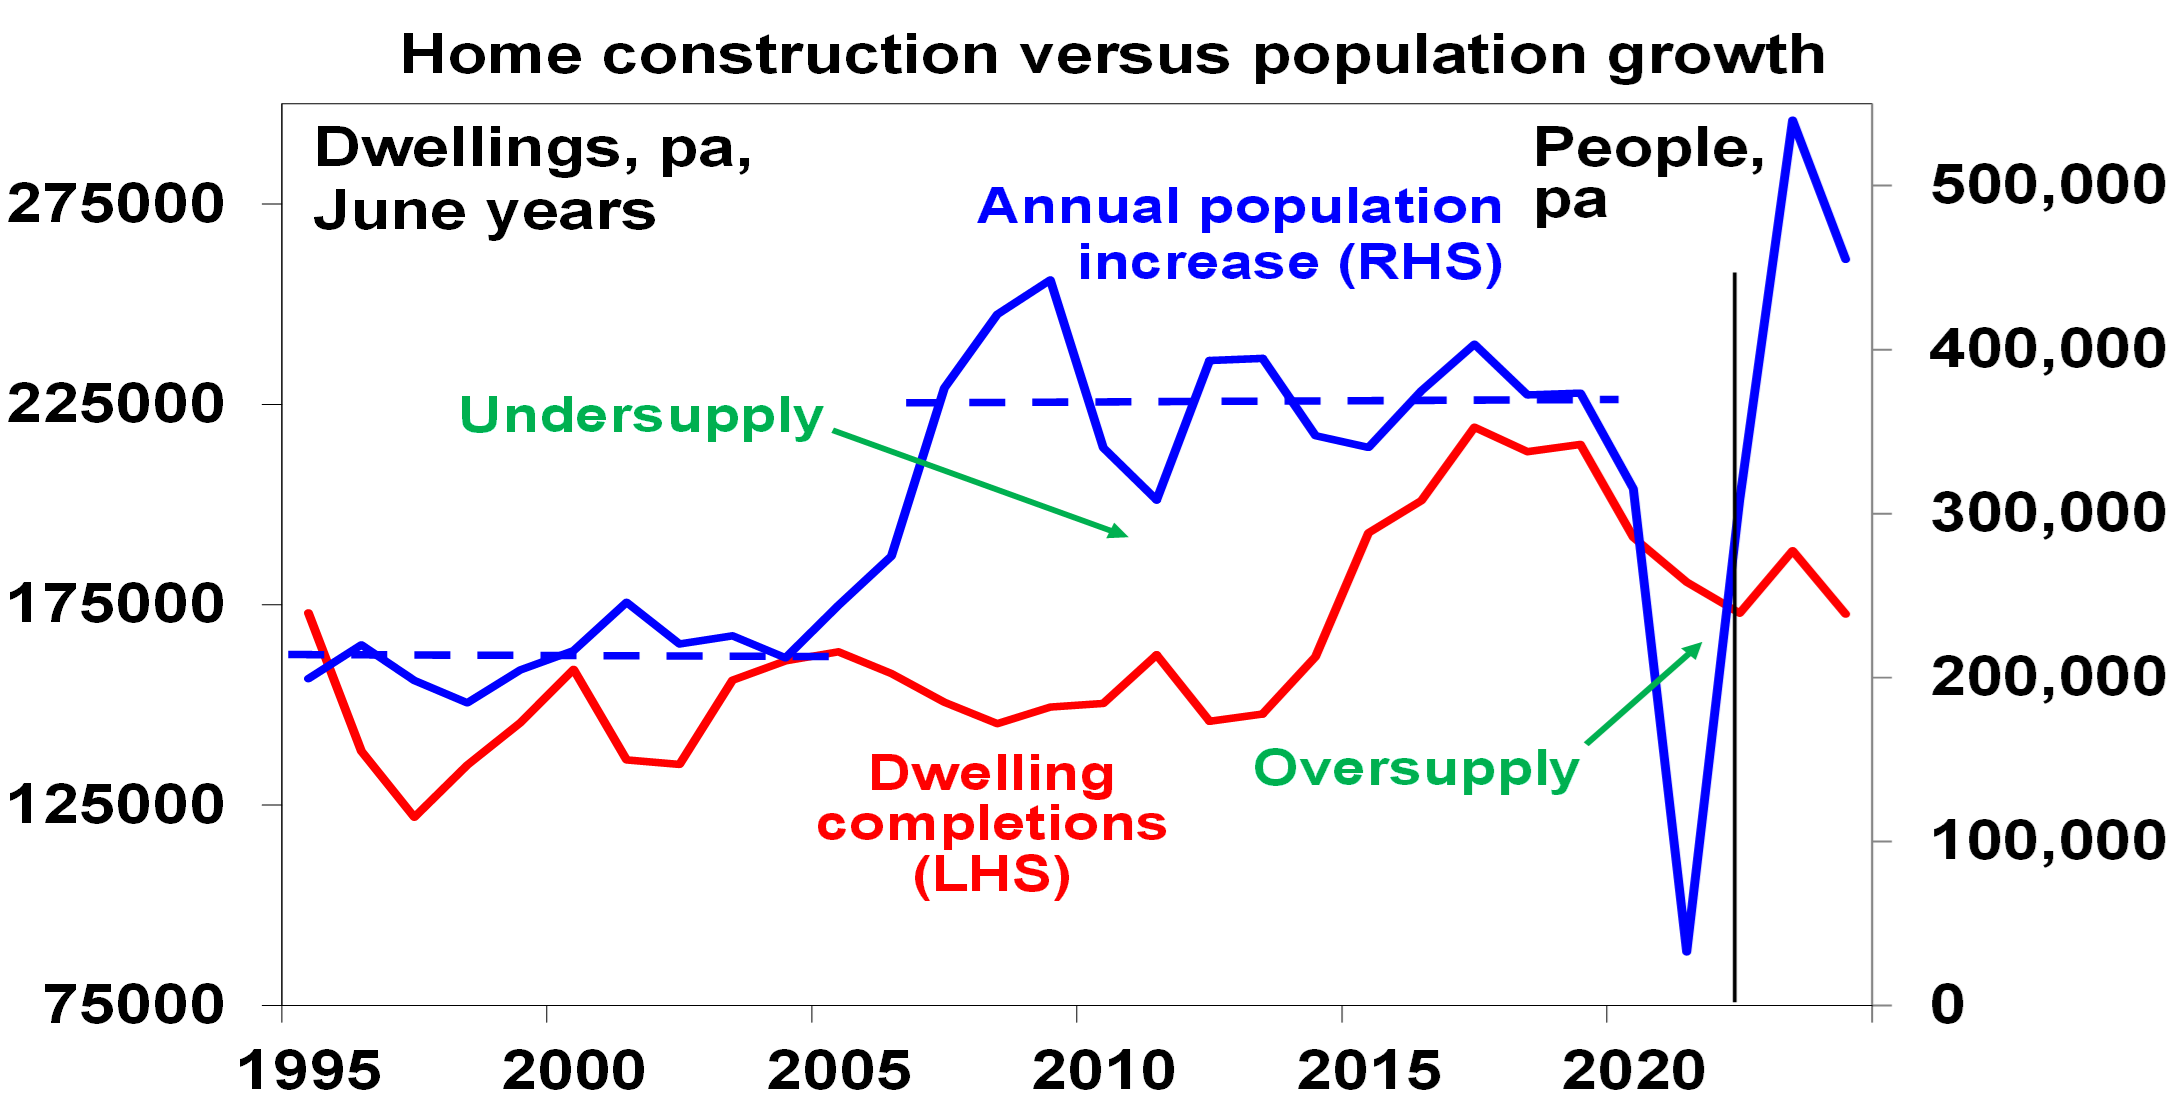
- Immigration has returned far quicker than expected and is now likely to be around 400,000 this financial year, which is well up from 5940 in lockdown impacted 2021 and well above the 235,000 forecast in last October’s Budget. The rapid rebound in immigration over the last 18 months roughly equates to demand for an extra 200,000 dwellings.
- At the same time the supply of new dwellings has slowed with labour shortages, cost increases and falling building approvals.
- As such we are seeing a renewed surge in the undersupply of housing.
Source: ABS, AMP
- This has occurred against the background of a decline in average household size to less than 2.5 people per dwelling through the pandemic, which the RBA estimates has added around 120,000 households to underlying dwelling demand. This largely offset the negative impact on demand from the hit to immigration through the pandemic lockdown. It could reverse again with rising housing costs but so far this is unknown.
- The very tight housing supply situation is reflected in capital city rental vacancy rates being at a record low of around 1% and this is leading to a surge in rents. This in turn is likely driving some to seek to buy a property as its harder to find rental property.
- Foreign demand for property is reportedly returning – led by China.
- First home buyer exemptions from stamp duty in NSW and other government support programs will be boosting demand.
- Despite the rise in interest rates, listings remain low tracking down around 22% from their five-year average according to CoreLogic.
- There’s a growing expectation that the RBA cash rate is at or close to peaking.
Outlook – revising up our home price forecasts
The combination of surging underlying demand driven by immigration, tight supply, low listings and home buyers motivated by expectations rates may be peaking & the historical record showing prices rebounding quickly after falls, tight rental markets and a fear of missing out appear to be dominating the drag from high interest rates and the slowdown in the economy. As such, our forecast for a top to bottom fall of 15-20% out to late this year is looking too pessimistic and we have revised our national average home price forecast for this year from a fall of 7% to flat to up slightly & expect roughly 5% growth next year. This assumes the RBA cuts rates through next year and the economy has a soft landing.
But the risk of another leg down remains high
However, the headwinds facing the property market are significant and likely at least to provide a constrained ride versus past recoveries with the high risk of a resumption of the downswing (putting us back on track for our original forecast of a 15-20% top to bottom fall in property prices).
- The first point to note is that this property cycle has been a bit unusual. Normally it’s taken several interest rate hikes to knock property prices down because it takes time to cool demand, for unemployment to rise and for distressed sales to increase. However, in this cycle property prices started to fall immediately when rates started to go up and at a time when the underlying property demand/supply situation was tightening. And the last three property price upswings (from 2009, 2012 and 2019) required an easing in monetary policy to get underway (see the ovals in the next chart).
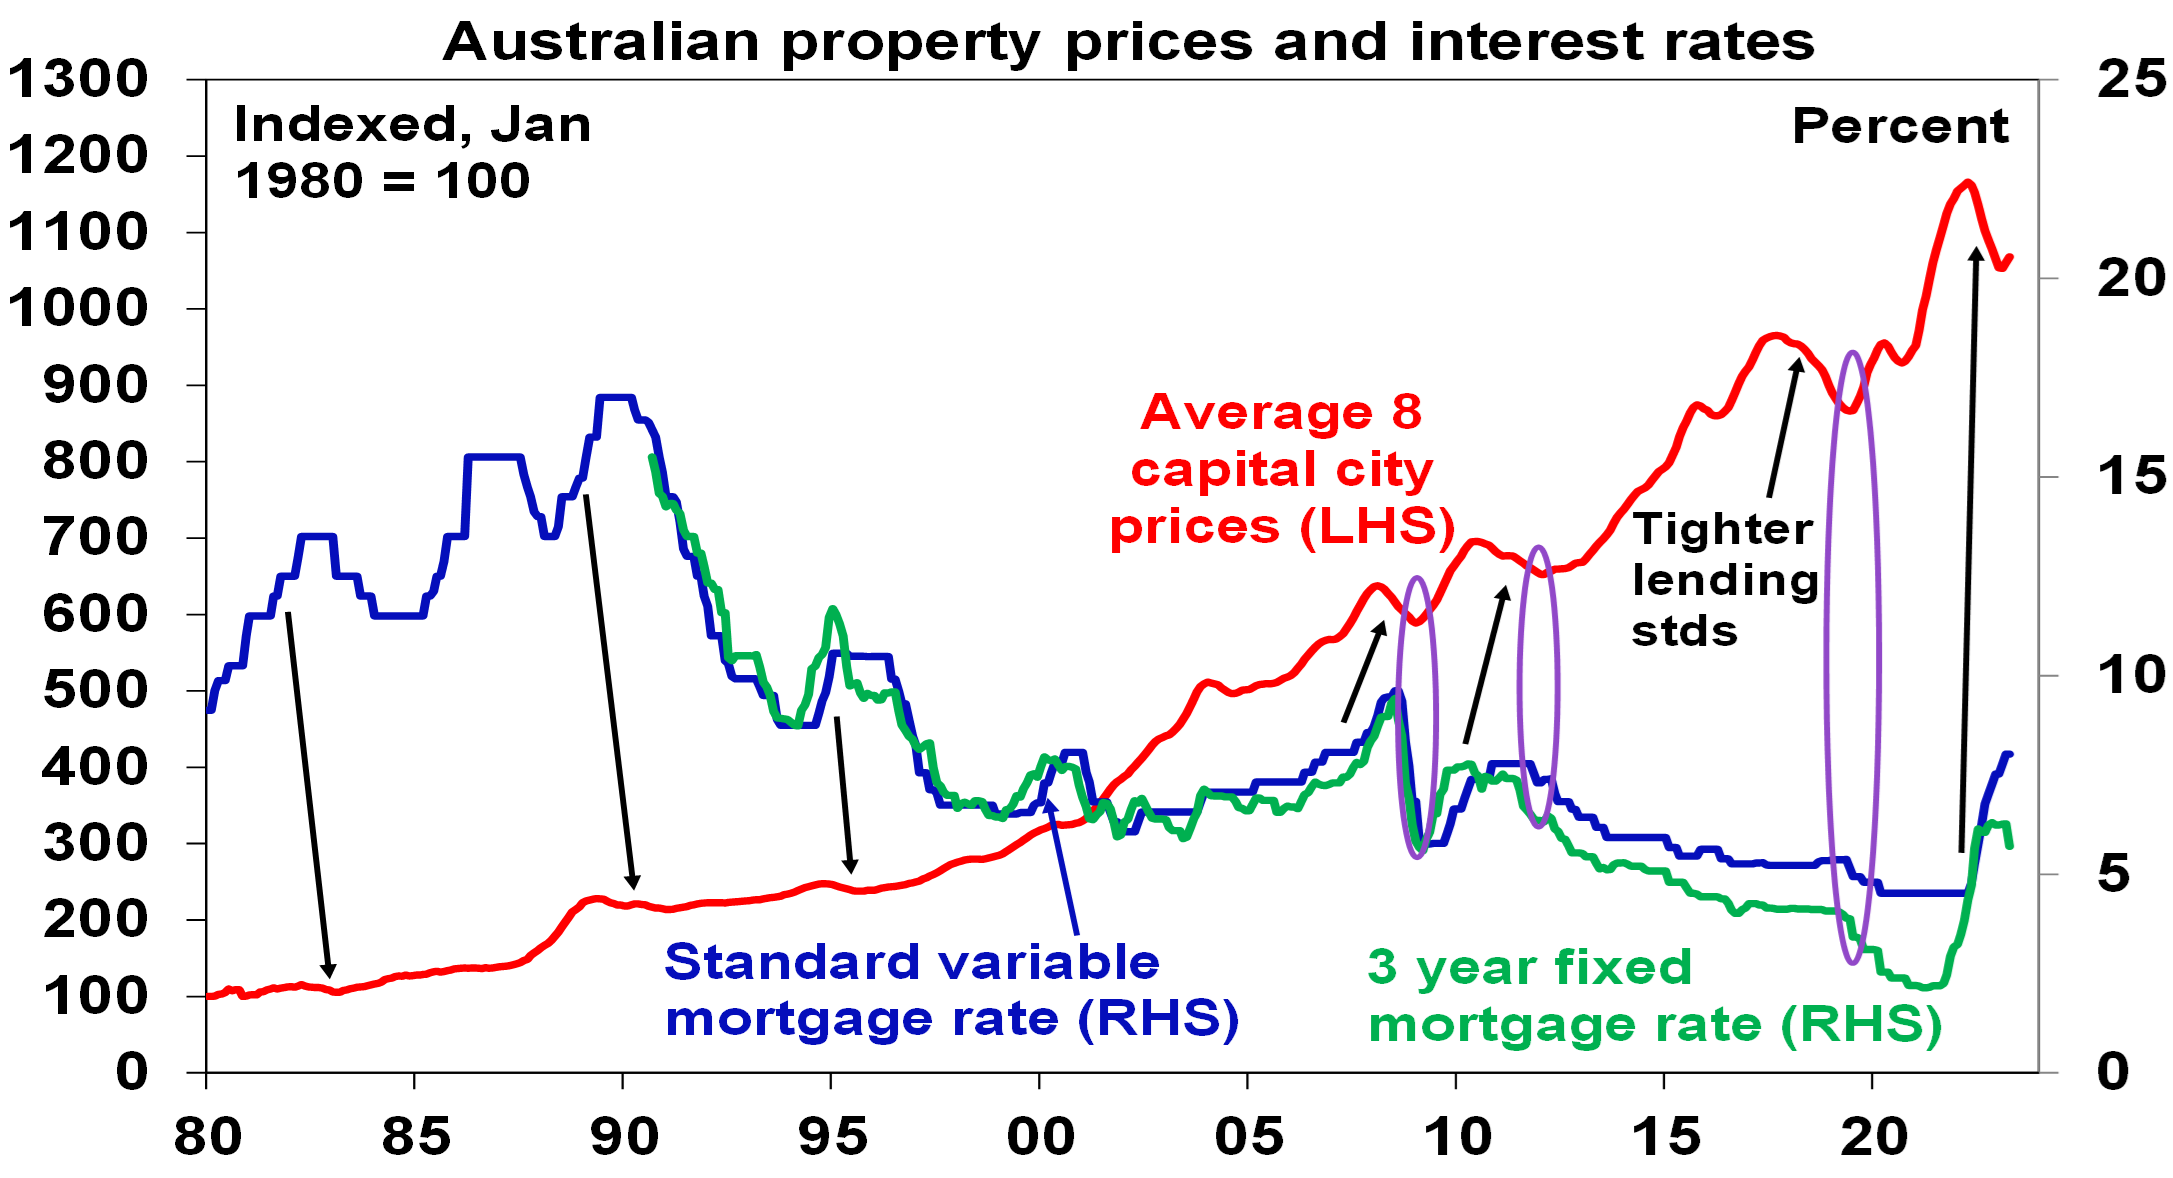
Arrows show the normally lagged lead from rate hikes to price falls. Source: CoreLogic, RBA, AMP
- So maybe the price slump last year ran ahead of itself and what we are seeing now is just a correction leaving open the risk of another down leg as the full dampening impact of higher interest rates flows through to property demand and listings and until the RBA cuts rates.
- In this regard, there is likely still significant pain to come from higher rates. Household debt servicing payments as a share of income have already risen to their highest in more than a decade and a rise in the cash rate to 4.1% would see them pushed to record levels. The RBA estimates that 40% of home borrowers have less than 3 months of prepayment buffers, 15% of variable rate borrowers will have negative cash flow by year end if the cash rate rises to 3.75% and nearly 900,000 fixed rate mortgages are due to reset to interest rates that are more than double their initial level, with much of this due to occur this quarter and next. At the same time unemployment is likely to rise and household size may rise due to the surge in rents. This all runs the risk of another hit to buyer demand & more distressed sales.
- While we think that rates are at or close to peaking rate, cuts are unlikely until late this year at the earliest and the risk of more rate hikes remains high given still high inflation, upside risks to wages and RBA concern that very strong population growth will add to inflation.
- The hit to home buying capacity from rate hikes – of 27% for a buyer with a 20% deposit and average full-time earnings – remains, even if rates have stopped rising. See the next chart. There was a divergence versus prices in 2003-2008 when buyer capacity fell as rates rose but prices rose due to a surge in demand from high immigration levels associated with the mining boom with the divergence ultimately eliminated with the rapid rate cuts in the GFC. This time around we are seeing a similar supply shortfall, but rapid rate cuts are unlikely. So, this is likely to remain on ongoing constraint on buyer demand.
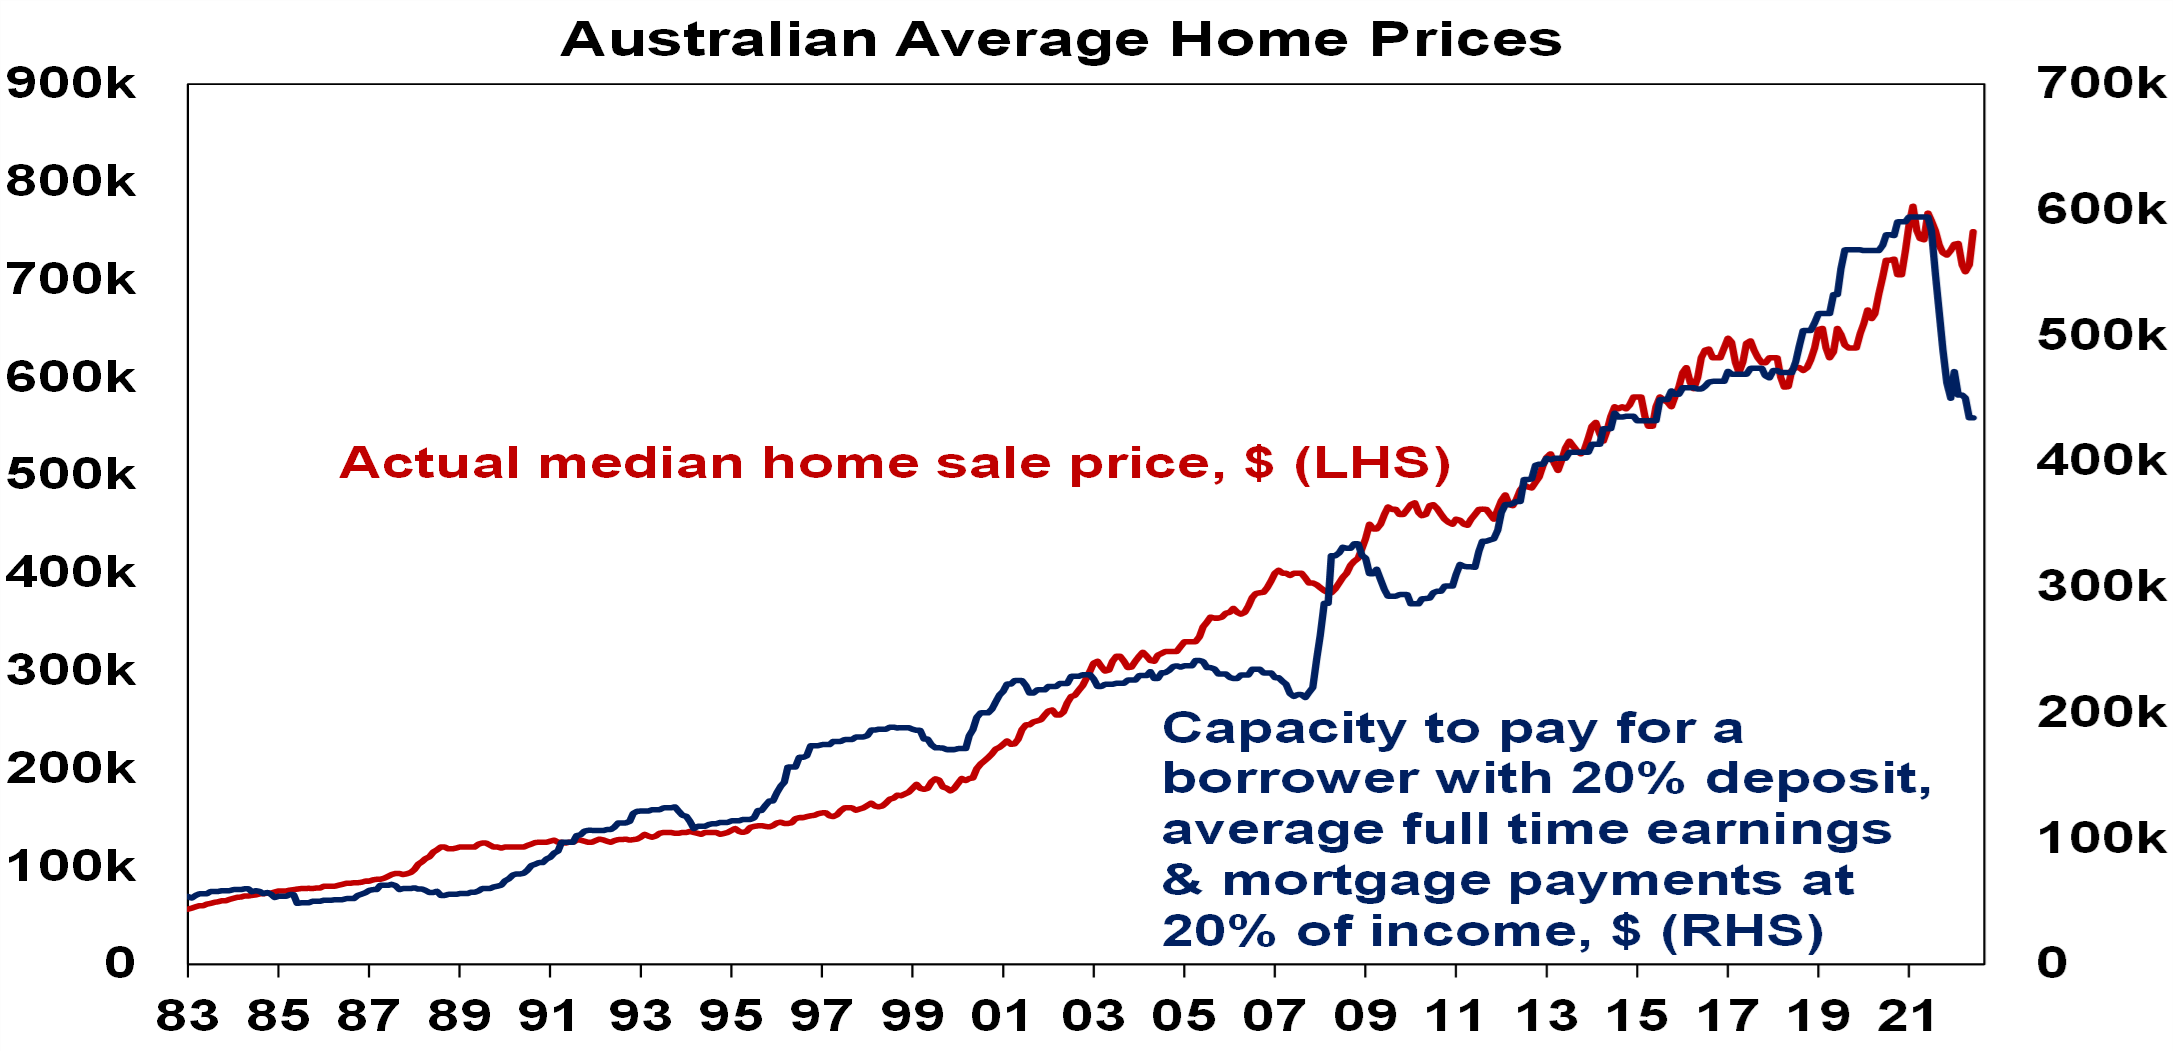
Source: RBA, CoreLogic, AMP
- All measures of housing affordability are poor. Despite the fall in prices from their highs it takes over 10 years for someone on average full-time earnings to save for a deposit, versus 5 years 30 years ago.
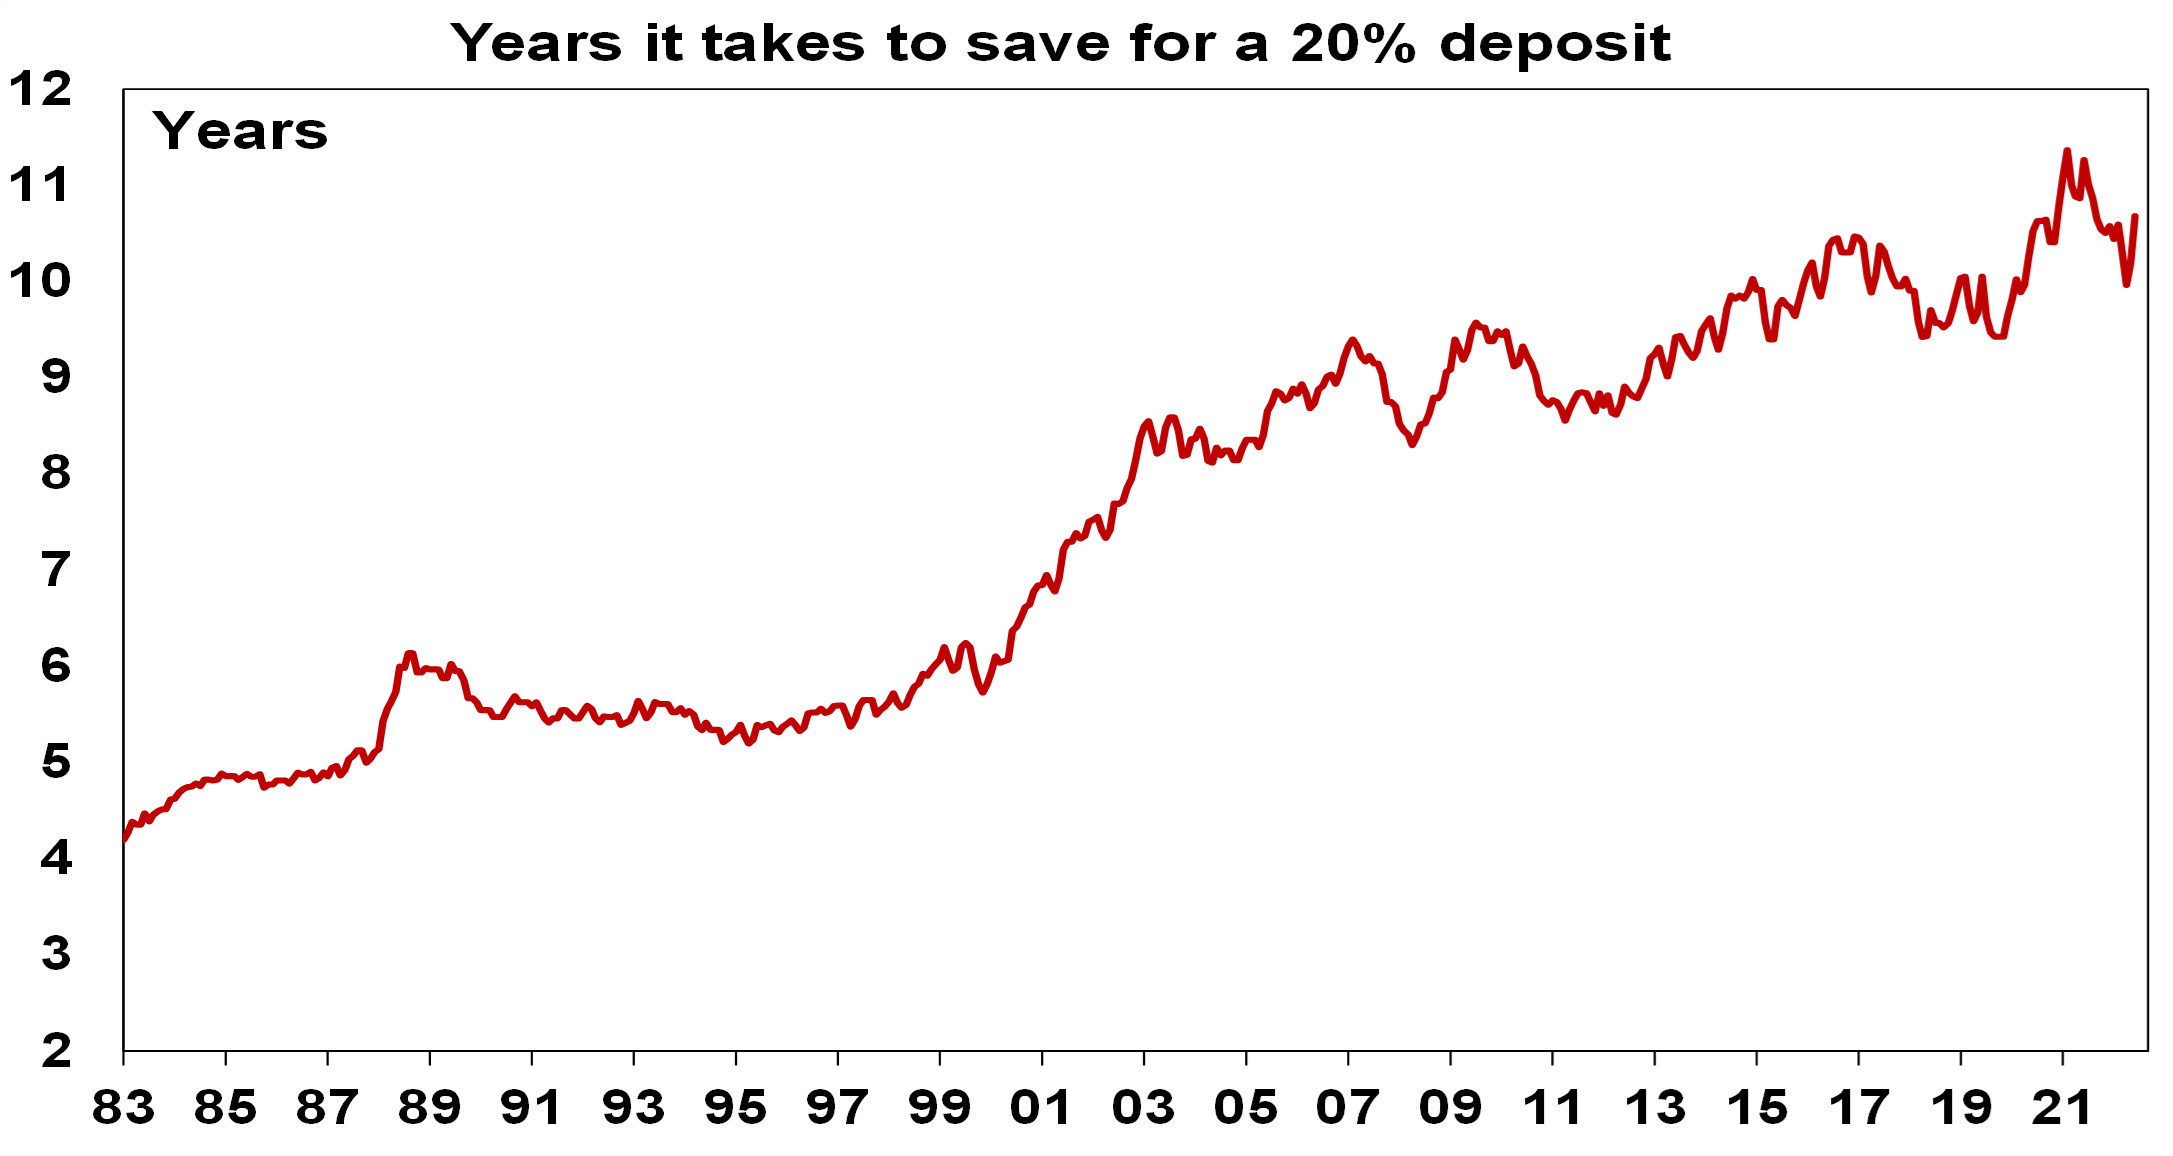
Source: CoreLogic, AMP
Concluding comment
Given the resurgence in underlying demand on the back of very high immigration levels and constrained supply we have revised up our home price forecasts – which is not something I feel entirely comfortable with (given the risks from higher interest rates) or like (given horrible housing affordability). Our base case is now for flat to slightly up prices this year followed by a 5% rise next year. Sydney (benefitting from the surge in immigration) and Perth (with better affordability) are likely to lead the way. However, the headwinds of higher interest rates and poor affordability will likely constrain the upswing at the very least but also mean there remains a still very high risk (which I would put at 45%) of another down leg as rate hikes fully impact and unemployment starts to rise. The conflicting forces of higher rates and a slowing economy, but a chronic demand/supply imbalance make the property market very hard to read with greater than normal uncertainty. Interest rates, unemployment and auction clearance rates are key indicators to watch.
What you need to know
While every care has been taken in the preparation of this article, neither National Mutual Funds Management Ltd (ABN 32 006 787 720, AFSL 234652) (NMFM), AMP Limited ABN 49 079 354 519 nor any other member of the AMP Group (AMP) makes any representations or warranties as to the accuracy or completeness of any statement in it including, without limitation, any forecasts. Past performance is not a reliable indicator of future performance. This document has been prepared for the purpose of providing general information, without taking account of any particular investor’s objectives, financial situation or needs. An investor should, before making any investment decisions, consider the appropriateness of the information in this document, and seek professional advice, having regard to the investor’s objectives, financial situation and needs. This article is solely for the use of the party to whom it is provided and must not be provided to any other person or entity without the express written consent AMP. This article is not intended for distribution or use in any jurisdiction where it would be contrary to applicable laws, regulations or directives and does not constitute a recommendation, offer, solicitation or invitation to invest.
The information on this page was current on the date the page was published. For up-to-date information, we refer you to the relevant product disclosure statement, target market determination and product updates available at amp.com.au.